Statistical Methods for Samples of Interaction Networks (PhD)
This project was a collaboration between STOR-i, the Centre for Doctoral Training (CDT) at Lancaster University where I did my PhD, and Elsevier, an academic publishing company. Elsevier provide various online services and tools for researchers, such as Mendeley and ScienceDirect, and were interested in the problem of user segmentation - understanding who their users are and how they interact with their platforms. Our goal was to develop novel methodologies to assist with this task.
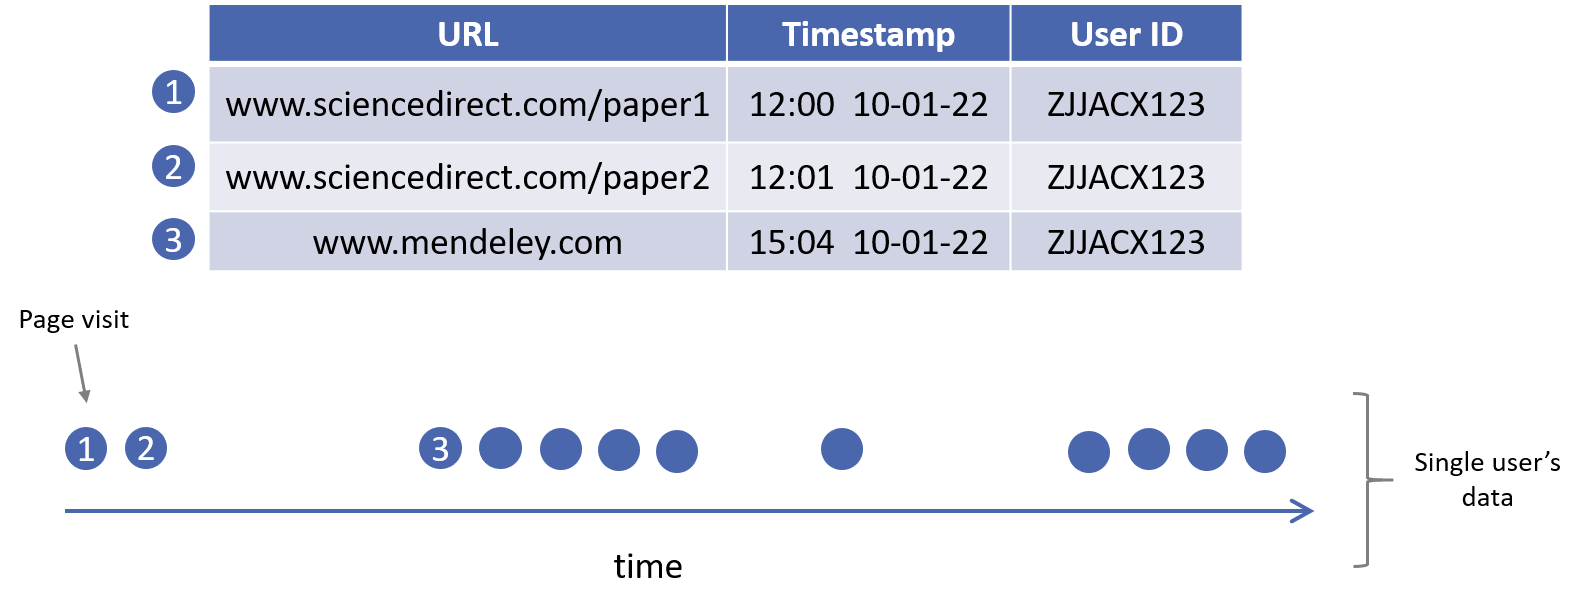
Of particular interest at the time was analysis of clickstream data (Fig. 1), which contains information regarding visits of users to Elseiver webpages. The data has two key properties which we decided to leverage. Namely, it is both intermittent and bursty, with cascades of clicks in quick succession followed by periods of inactivity. As we will show, this provided a means to interpret this as network data.

Users as interaction networks
In the most general sense, network data consists of relational information amongst a collection of entities. A ubiquitous example is social network data, encoding the friendships (relations) amongst a sample of individuals (entities). The increasing prevalence of data in this form has driven a burgeoning interest in methodologies suitable to their analysis, developing into a sub-field of statistics referred as "statistical network analysis" - see for example the review by Salter-Townsend et al. (2012),[1] or the book of Kolaczyk and Csárdi (2014).[2]
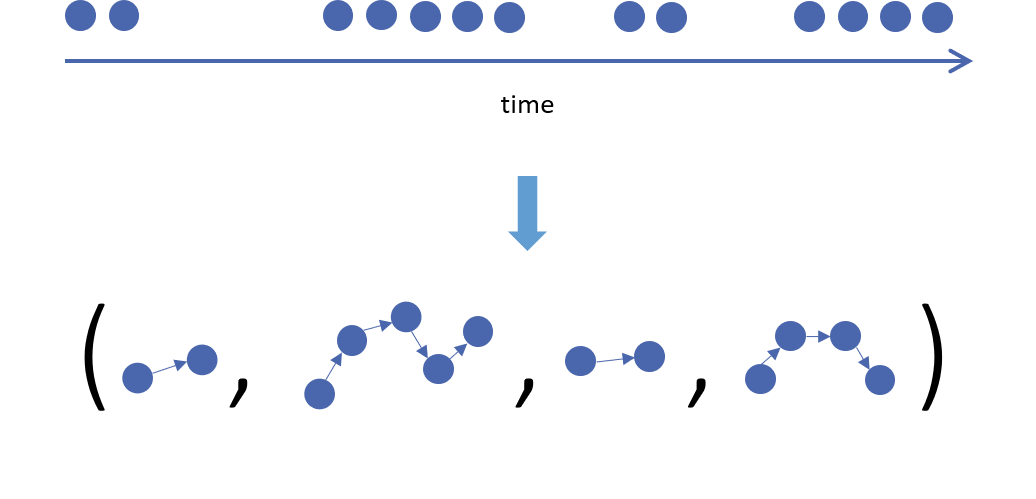
How does this relate to clickstreams? Well, by using the intermittent and bursty property of these data, we are able to partition a single user's data into a sequence of paths over webpages (Fig. 2). This represents an instance of a so-called interaction network, where one observes interactions amongst entities over time (here entities=webpages and interactions=paths). This differs subtly from the case where relations amongst entities are observed explicitly, such as in traditional social network data, and has led to recent work in the literature on new models.[3][4]

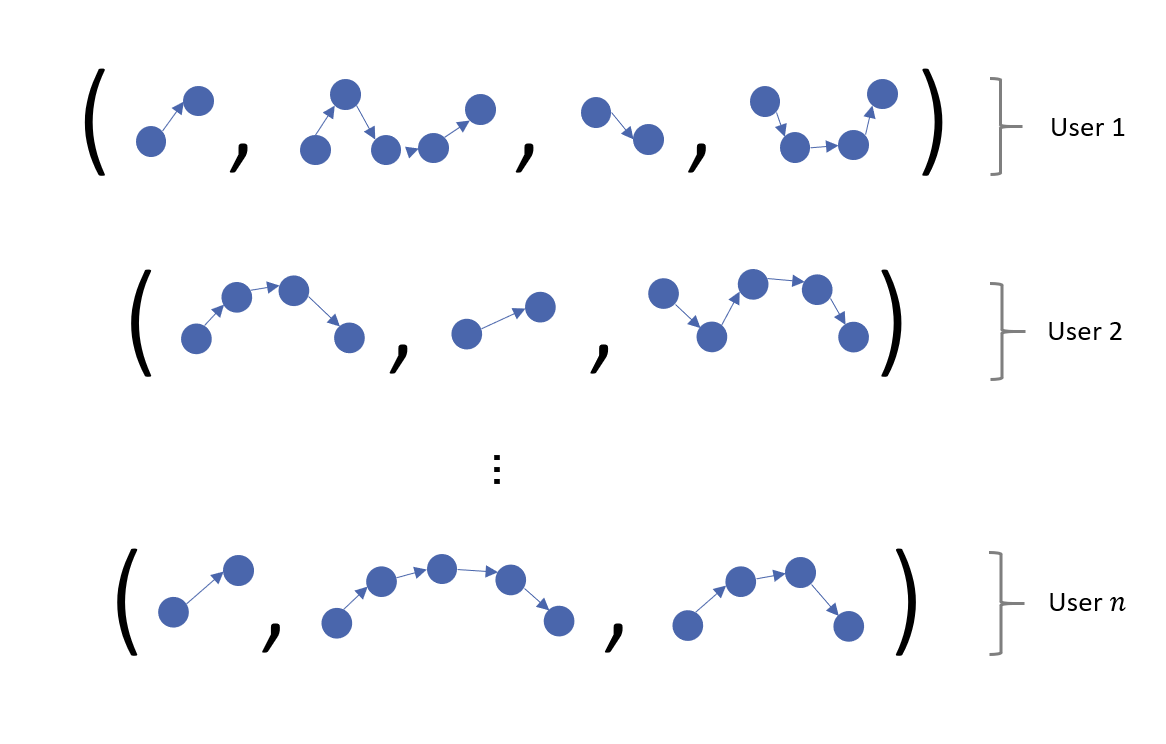
This, however, is not the complete picture. There is not data on just one user but many, leading to a sample of interaction networks (Fig. 3). Data of this form, where we observe samples of networks, is appearing ever more frequently. This is being driven heavily by data collection advancements in fields such as neuroscience, where fMRI brain scan data are being converted to networks summarising brain connectivity. Relative to the case where a single network is observed, this raises new questions for a data analyst. For example, one might wonder what is the "average" network? Or how variable are the networks about this average? This has motivated a string of recent work in the literature on methods capable of providing answers to such questions.[5][6]

Herein lies the research problem I looked to solve in my PhD: analysing samples of interaction networks. To the best of our knowledge, this had not be touched upon in the literature. As it transpired, I ended-up focussing on two main problems
Measuring the dissimilarity of two interaction networks;
Modelling a sample of interaction networks;
details of which can be found below.
Comparing interaction networks
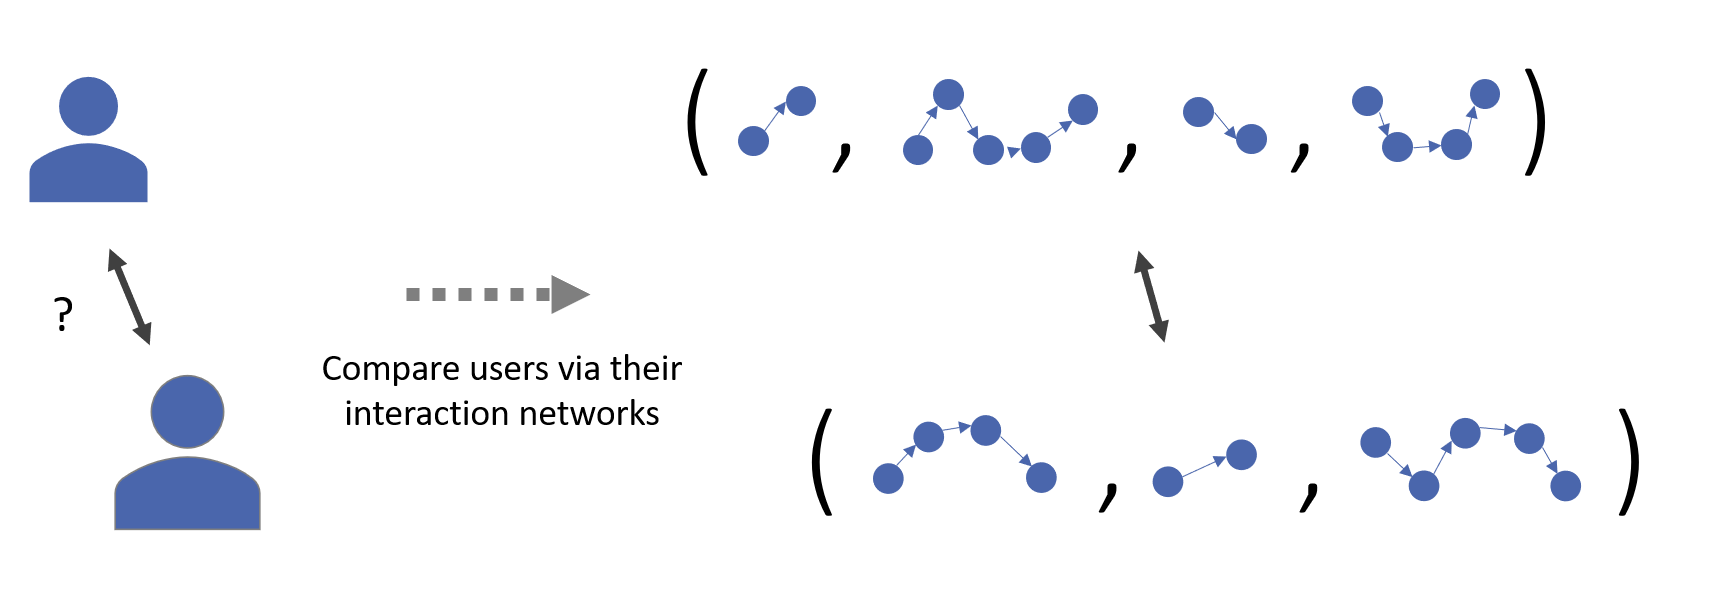
In this part of the project, we looked into ways one could go about defining distance measures between interaction networks, serving as a proxy for a distance between Elsevier users (Fig. 4). Given any sample of data points (could be interaction networks, or more familiar vector representations) if you have some way to measure their dissimilarity this immediately opens you up to a variety of analytical methods. This includes dimension reduction methods like multidimensional scaling (MDS), which can aide visualisation, clustering algorithms such as DBSCAN, which can be used to group data points, or classification and regression via k-nearest neighbors. Inline with the research motivation, of most interest for us and Elsevier were clustering algorithms, which would provide a means to group users based upon their clickstreams.

This work culminated in a survey paper which you can view here, wherein we reviewed various distances and illustrated their applicability via an example data analysis. In particular, we did an analysis of the in-play football data released by StatsBomb (see here), and a dataset on user interactions with the location-based social network Foursquare released by Yang et al. (2015)[7] (see here).
Modelling a sample of interaction networks

When faced with a sample of interaction networks - perhaps a group of users inferred by a clustering algorithm - an immediate question is one of summarisation: what does this group represent? In this second part of the project, we considered answering this question via a Bayesian modelling approach; eliciting a model for these data via location and scale parameters, akin to a Gaussian distribution. Via a speciliased Markov chain Monte Carlo (MCMC) algorithm, we were able to infer these model parameters given a sample of data, providing summary measures for the sample. Most notably, one of these parameters served as the network-equivalent of the mode (Fig. 5), providing a notion of average for this non-standard data structure.
We drew this work together into a paper which you can view here, wherein we conduced simulation studies confirming the efficacy of our methodology and MCMC inference scheme, and conducted an example data analysis of the Foursquare data of Yang et al. (2015).[7]
References
| [1] | Salter-Townshend, M., White, A., Gollini, I., & Murphy, T. B. (2012). Review of statistical network analysis: models, algorithms, and software. Statistical Analysis and Data Mining, 5(4), 243-264. |
| [2] | Kolaczyk, E. D., & Csárdi, G. (2014). Statistical analysis of network data with R (Vol. 65). New York: Springer. |
| [7] | Dingqi Yang, Daqing Zhang, Bingqing Qu. Participatory Cultural Mapping Based on Collective Behavior Data in Location Based Social Networks. ACM Trans. on Intelligent Systems and Technology (TIST), 2015 |
| [4] | Cai, D., Campbell, T., & Broderick, T. (2016). Edge-exchangeable graphs and sparsity. Advances in Neural Information Processing Systems, 29. |
| [3] | Crane, H., & Dempsey, W. (2018). Edge exchangeable models for interaction networks. Journal of the American Statistical Association, 113(523), 1311-1326. |
| [5] | Lunagómez, S., Olhede, S. C., & Wolfe, P. J. (2021). Modeling network populations via graph distances. Journal of the American Statistical Association, 116(536), 2023-2040. |
| [6] | Durante, D., Dunson, D. B., & Vogelstein, J. T. (2017). Nonparametric Bayes modeling of populations of networks. Journal of the American Statistical Association, 112(520), 1516-1530. |
