Supplement - Modelling Populations of Path-observed Networks - ISBA World Meeting 2022
George Bolt - g.bolt@lancaster.ac.uk - https://gmbolt.github.io
- Animation shows multiset of paths corresponding to marker on traceplots (big gaps separate distinct paths);
- Green entries are common with mode, whilst magenta entries highlight errors;
- Simulation parameters
- = {(1,2,1), (1,3,2,1,4), (1,2,4), (1,5,1), (1,5), (2,1)} (mode)
- (dispersion)
- (sample size)
- taken as matching distance (defined on posterior), with distance between paths based upon common subsequences
- Initialised MCMC chain at and .
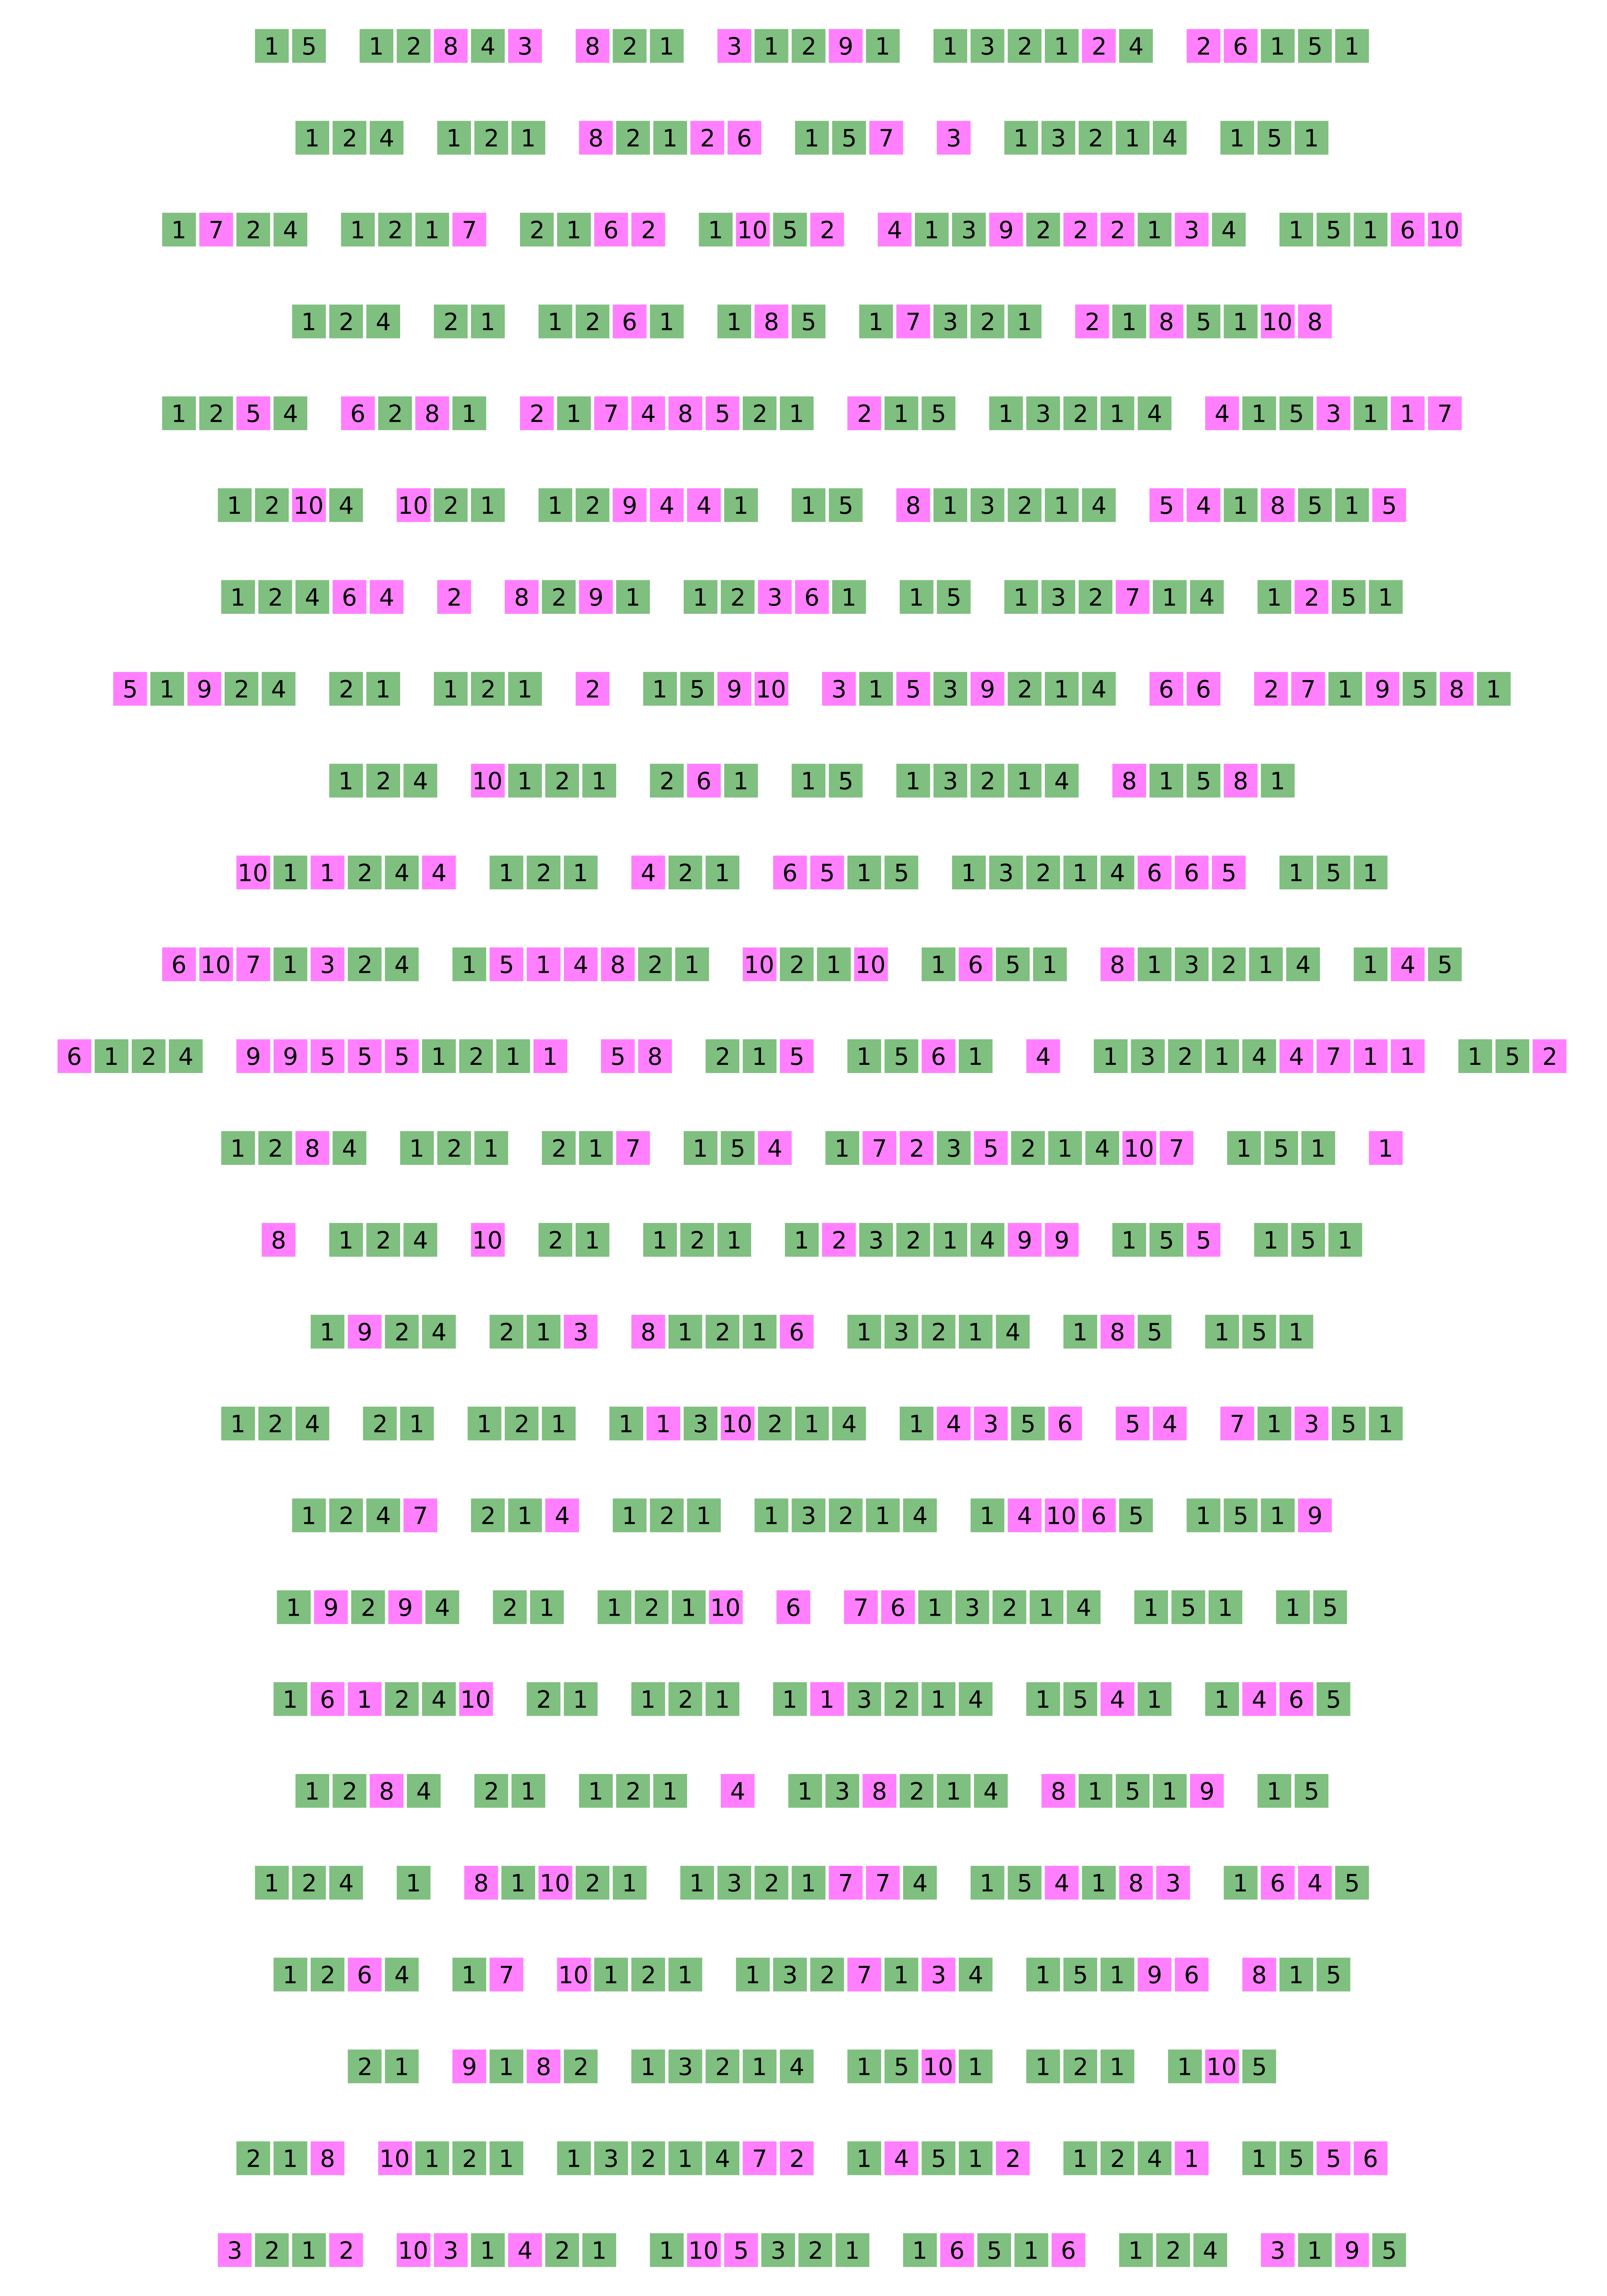
Data
- Below is the observations used in this simulated example, drawn from an model (approximately via MCMC algorithm);
- Green entries are common with the mode , whilst pink entries highlight errors.